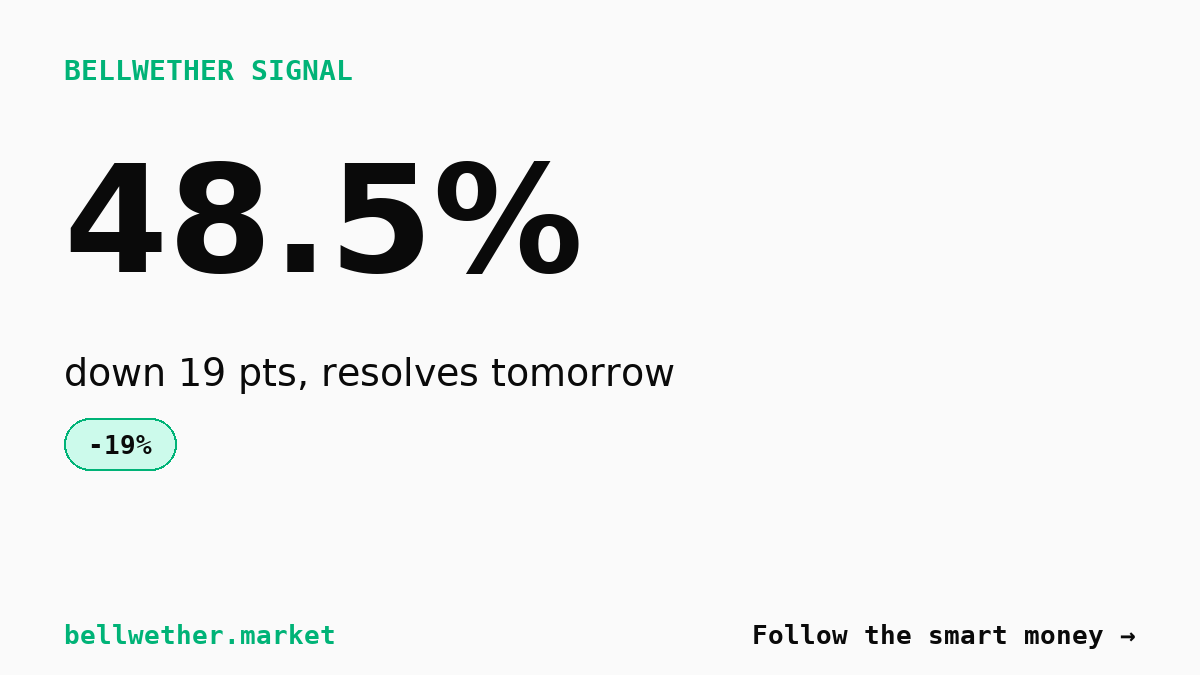
The market asking whether the United States and Iran will reach an effective ceasefire by September 4 closed Friday at 48.5 percent, down from 67.5 percent twenty-four hours earlier. That 19-point drop arrived on volume of nearly $293,000, enough to make this the strongest signal in the current Bellwether dataset. The verdict: traders who bet on de-escalation changed their minds in a hurry, and they did so with real money.
The resolution date sits one day away. After a week of military strikes and counter-strikes, the market now prices the next twenty-four hours as a coin flip. That alone tells you how quickly hope for calm evaporated.
What moved
Volume reached $292,754 over the past day, heavy for a geopolitical binary and enough to give the liquidity component of the Bellwether Signal Score a perfect 40 out of 40. The 19-point decline in implied probability earned the maximum 35 points for move magnitude. Genuine uncertainty, measured by distance from zero and one hundred, added 24 out of a possible 25 points. The composite score of 99 out of 100 places this market at the top of the current signal table, ahead of a US Open tennis contract, a Counter-Strike esports match, and two midterm election questions.
The market opened the week near 70 percent, drifted lower through midweek, then fell sharply on Thursday and Friday as volume spiked. The drop accelerated in the final twenty-four hours of the measurement window, suggesting new information or a sudden shift in flow rather than a slow grind.
What is driving it
NPR reported on August 30 that the US military struck targets inside Iran and that Tehran fired back, reigniting hostilities that many traders had hoped were cooling. ABC7 New York carried similar coverage the same day, describing the exchange as a flare-up after a period of relative quiet. Those strikes occurred seven days before the current measurement window, but their consequences appear to have crystallized in trader expectations only in the past forty-eight hours.
Il Sole 24 ORE noted on September 3 that oil prices rose following the US-Iran air strikes, a detail that confirms the strikes registered in commodity markets as a meaningful escalation. The Jerusalem Post published live updates on September 2, though the headline does not specify new developments. WUSA9 ran a piece on September 4 about the Houthis, the Iran-backed group operating in Yemen, becoming a disruptive force in the region. That story does not describe a discrete event but underscores the broader instability.
Futura Doctrina, a defense-focused newsletter, mentioned a peace push in Ukraine and Chinese activity in the Pacific on September 1 but did not tie that coverage directly to US-Iran tensions. Taken together, the headlines confirm that military action between Washington and Tehran resumed in late August and that markets reacted, but they do not point to a single catalyst in the past twenty-four hours that would explain the size and timing of the price move.
The most straightforward reading is that traders who bought the ceasefire contract earlier in the week saw the strike-and-counterstrike cycle as a temporary interruption and expected cooler heads to prevail before September 4. As the deadline approached with no sign of de-escalation, those traders either closed their positions or sold into the rally, while new participants entered on the No side. The headlines from August 30 onward describe a pattern of escalation, not de-escalation, and that pattern became impossible to ignore as the clock ran down.
It is also possible that the drop reflects thin orderbooks and a small number of large trades rather than a broad reassessment. The volume is heavy for a geopolitical market but still modest in absolute terms. A single well-informed trader or a coordinated group could move the price 19 points if liquidity dried up on one side. The headlines provide context, but they do not prove causation. The most honest summary is that the strikes from late August set the stage, and the market repriced sharply in the final stretch as the probability of calm by September 4 collapsed.
How strong is this signal
The Bellwether Signal Score of 99 out of 100 reflects three components. Liquidity, weighted at 40 percent of the total, measures whether the market has enough volume to make the price meaningful. A score of 40 out of 40 here means the $292,754 in daily volume clears the threshold for a credible signal. Move magnitude, weighted at 35 percent, captures the size of the price change relative to historical norms for similar contracts. A score of 35 out of 35 means the 19-point drop ranks among the largest single-day moves Bellwether has recorded for geopolitical binaries. Genuine uncertainty, weighted at 25 percent, measures whether the market sits far enough from zero or one hundred to allow for real disagreement. A score of 24 out of 25 means the 48.5 percent close leaves room for the outcome to go either way.
The score does not measure whether the market is correct. A high score tells you the signal is loud, not that it is right. It also does not account for resolution risk, the chance that the market’s definition of ceasefire differs from the eventual adjudication. The score treats volume as a proxy for information, but volume can also reflect noise, positioning, or late-stage capitulation. A 99 does not mean the ceasefire will fail; it means the market moved hard, on size, with time left for the outcome to surprise.
How to read a price like this
An implied probability of 48.5 percent means that if you could run this scenario one hundred times under identical conditions, the market expects the ceasefire to occur roughly forty-nine times. That number comes from the midpoint of the bid and ask, the prices at which traders are willing to buy and sell the Yes contract. If the best bid is 47 and the best ask is 50, the midpoint is 48.5, and that becomes the reported probability.
The move matters more than the level. A market that opens at 70 percent and closes at 48.5 percent tells you something different from a market that sat at 48.5 percent all week. The first scenario suggests a change in expectations; the second suggests stable disagreement. In this case, the drop from 67.5 to 48.5 in one day, following a longer slide from around 70 earlier in the week, signals a rapid unwinding of optimism.
Thin orderbooks amplify moves. If the Yes side has strong buyers at 67 but weak buyers at 50, a moderate amount of selling can push the price through multiple levels without much resistance. That does not make the move false, but it does mean the price reflects the most motivated traders at that moment, not a census of all informed opinion. Comparing this contract to others on Polymarket shows $292,754 in volume sits well above the median for single-day political and geopolitical markets, but it remains small next to major election contracts that trade millions. The signal is strong, but it is not indestructible.
What would change the picture
The market resolves in under twenty-four hours. Any move from here reflects either new information or final positioning before close. Concrete checkable conditions include: an official statement from Washington or Tehran announcing a pause in hostilities, a verified withdrawal of forces from contested areas, or a credible report from a neutral party such as the UN describing a halt in military action. The absence of new strikes between now and the deadline would not guarantee a Yes resolution, because the market’s definition of effective ceasefire may require an explicit agreement rather than mere inaction.
If the market reprices higher, look for headlines describing diplomatic progress, back-channel talks, or a unilateral de-escalation gesture from either side. If it drops further toward zero, expect reports of additional strikes, threats, or statements ruling out negotiation. Given the one-day window, the likeliest scenario is that the price oscillates in a narrow range as traders lock in gains or cut losses, unless a headline breaks in the next few hours that resolves the uncertainty early.
The caveats
Resolution depends on the market’s stated criteria, which typically require an effective ceasefire rather than a formal treaty. The definition of effective matters: does it mean zero military action, or does it allow for isolated incidents as long as broader hostilities cease? If the criteria are ambiguous, the market may resolve in a way that surprises participants on both sides.
Thin books mean large orders move prices more than they would in deeper markets. A 19-point drop on $292,754 in volume could reflect ten traders or two traders; the orderbook data are not public at this level of granularity. The move is real, but its breadth is uncertain.
Time to resolution sits at one day. That creates urgency but also limits the runway for new information to arrive. Markets close to expiration often see elevated volume from traders closing positions, and that flow can distort prices in either direction. A sharp move today may say as much about risk management as about updated forecasts.
Bellwether earns referral commission from Polymarket and from KalshiSpy, a paid trader-analytics tool. This analysis reflects the data and the headlines; it is not investment advice. Prediction markets carry risk of loss, and leverage or margin, where available, amplifies that risk. The purpose here is to explain what moved and why, not to recommend a trade.
For more on interpreting these numbers, see our guide on reading prediction market prices. For background on how these platforms operate, see prediction markets explained.